Functional near-infrared spectroscopy (fNIRS) is gaining popularity in different areas of neuroscience due to its ease of application, mobility and relatively high resistance to some types of artifacts. However, unlike other methods of brain activity registration, such as EEG, or fMRI, good planning of the montage of measurement channels is necessary before starting the registration. While there are fNIRS systems that allow for coverage of the entire head surface, it is much more common practice to tailor the position of emitters and detectors for optimal signal recording from areas crucial to the planned study .
From a research question to the registration
As with any scientific study, the type of data collected is determined by operationalising the variables concerned by the research hypotheses. In the case of studies involving fNIRS, the hypotheses usually focus on changes in oxy- and deoxy-hemoglobin levels in selected brain areas (regions of interest, ROIs), depending on the experimental conditions. Sometimes hypotheses also concern the relationship between the signal from different ROIs (e.g. connectivity studies) or the predictions based on the activity of specific ROIs (e.g. brain-computer interfaces, signal classification).
This means that the researcher, before recording, should decide from which areas of the brain (which ROIs) want to record to answer the research questions. Usually, ROIs are anatomical brain structures or groups of structures defined according to a specific brain model (e.g., Brodmann areas). ROIs are selected based on previous experience, research findings or theoretical assumptions. Once the ROIs are selected, they need to be translated into the position of emitters and detectors to record the proper signal.
Channels array design software
In general, the conversion of ROIs to fNIRS optodes montage is based on the relationship between the position of emitters and detectors and the transmission path of infrared light through the tissue layers under the optodes.
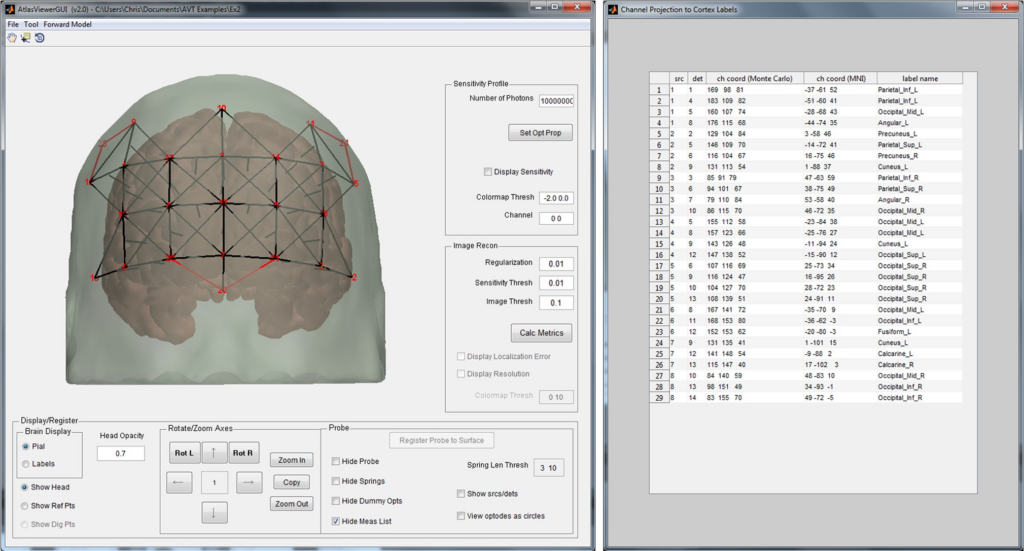
Fig. 1. AtlasViewer GUI Source: Aasted, C. M., Yücel, M. A., Cooper, R. J., Dubb, J., Tsuzuki, D., Becerra, L., … & Boas, D. A. (2015). Anatomical guidance for functional near-infrared spectroscopy: AtlasViewer tutorial. Neurophotonics, 2(2), 020801.
The AtlasViewer is an example of a software package that estimates the sensitivity of fNIRS channels concerning cortical structures located below them . Through this application, we can simulate the channels’ sensitivity before the experiment starts and adjust the optodes’ positioning so that they record the signal from the selected ROIs (Fig. 1.). It is also possible to load optodes locations (e.g. digitalized using a 3D scanner) from completed registrations and then calculate the variance of channel positions within the research group.
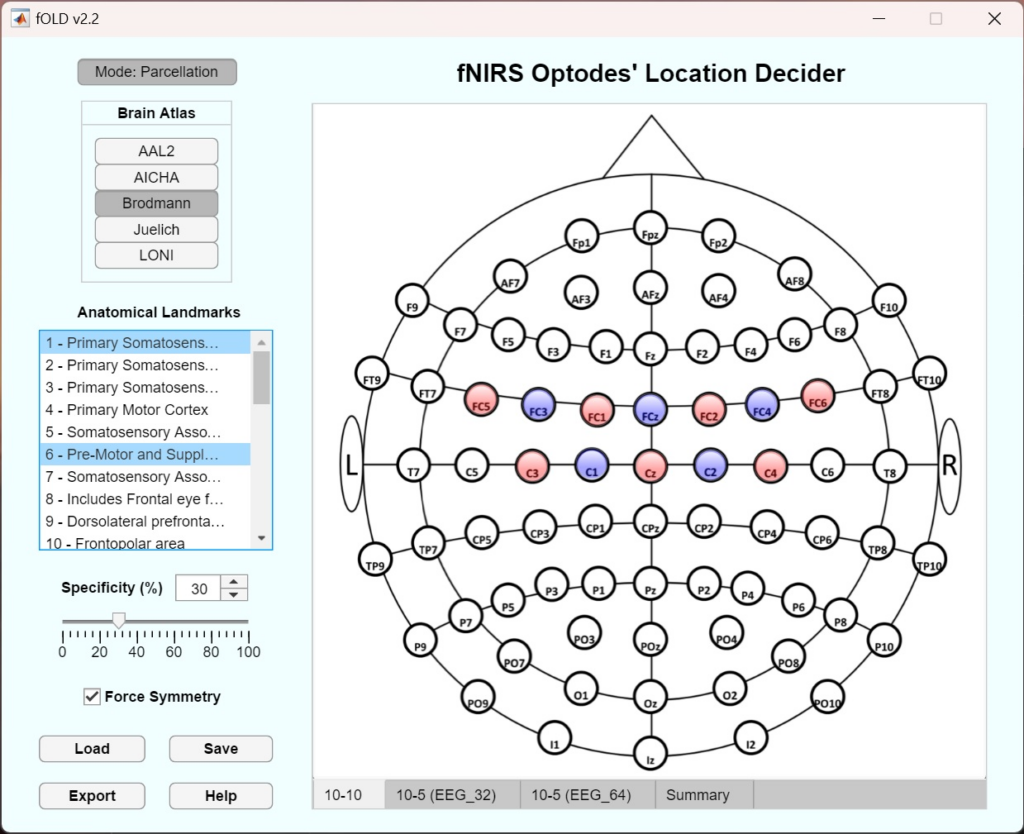
Fig. 2. fOLD GUI
We recommend that ROIs be selected according to existing knowledge in the research area before starting the data acquisition. Afterwards, using packages such as fOLD or devfOLD, a transformation of ROIs to fNIRS optodes montage in a 10-10 or 10-5 system should be performed. During signal acquisition, it is worth registering the exact position of emitters and detectors for each subject (e.g., using a 3D digitizer like Polhemus Patriot). The pre-recorded positions may be used to calculate the study group’s optode position variance and create a channels sensitivity model.
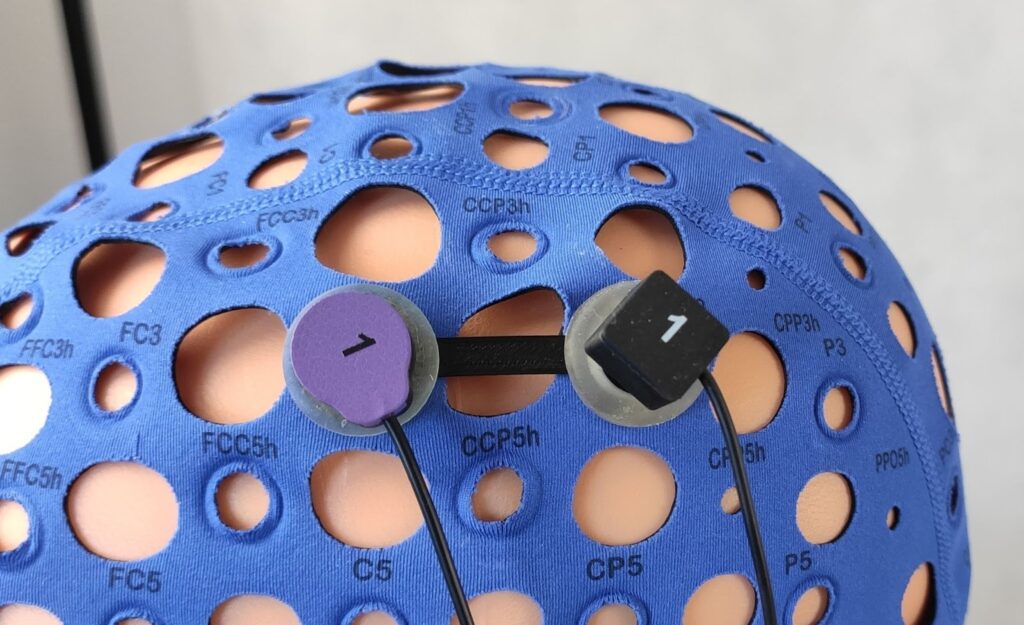
Fig. 3. The distance guard keeps a fixed distance of 3 cm between the emitter and the detector.
Please note: If you don’t have the option of recording the actual fNIRS optodes montage with a digitizer or 3D scanner, using the emitter/detector distance guards (Fig. 3.) included with every Cortivision PhotonCap kit is a good idea.
Examples of montages adjusted to different types of studies
Left and right-hand motor imagery
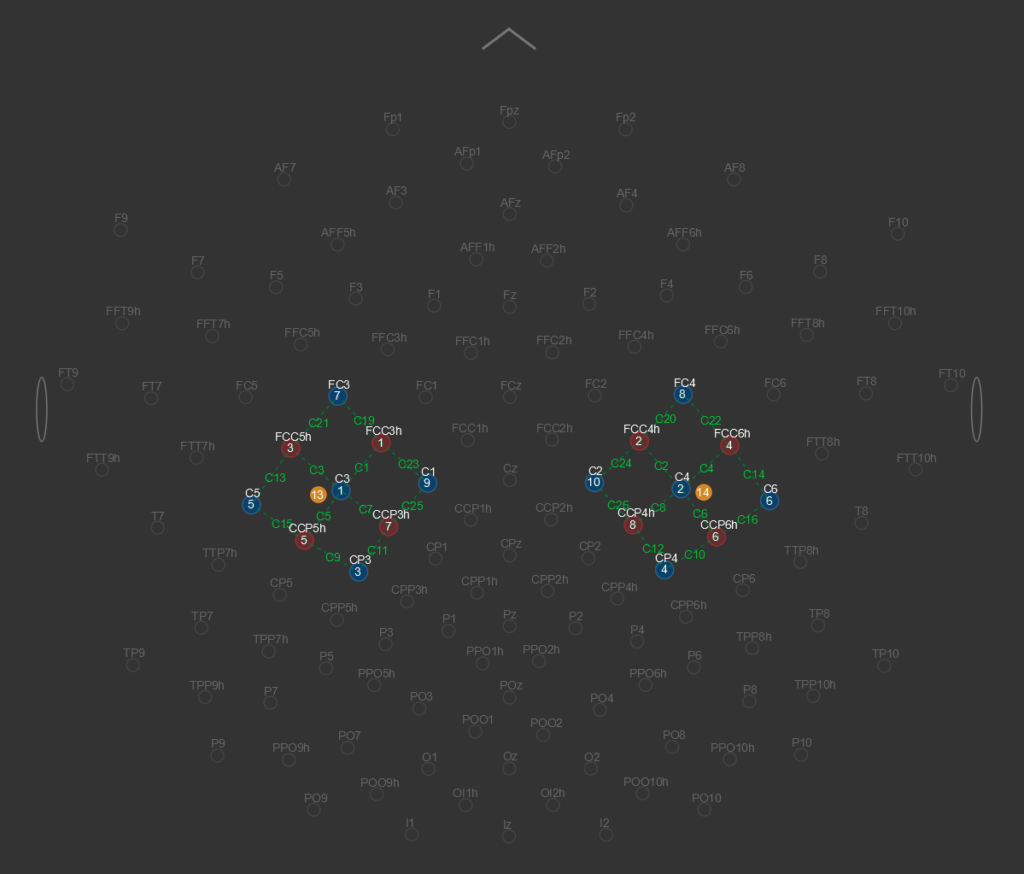
This montage is commonly used to measure the left and right sensorimotor cortex regions, which control both hands’ actual or imagined movement . It can be used, e.g. to measure brain lateralization or as part of the MI-BCIs online processing loop.
Task-positive, and task-negative networks
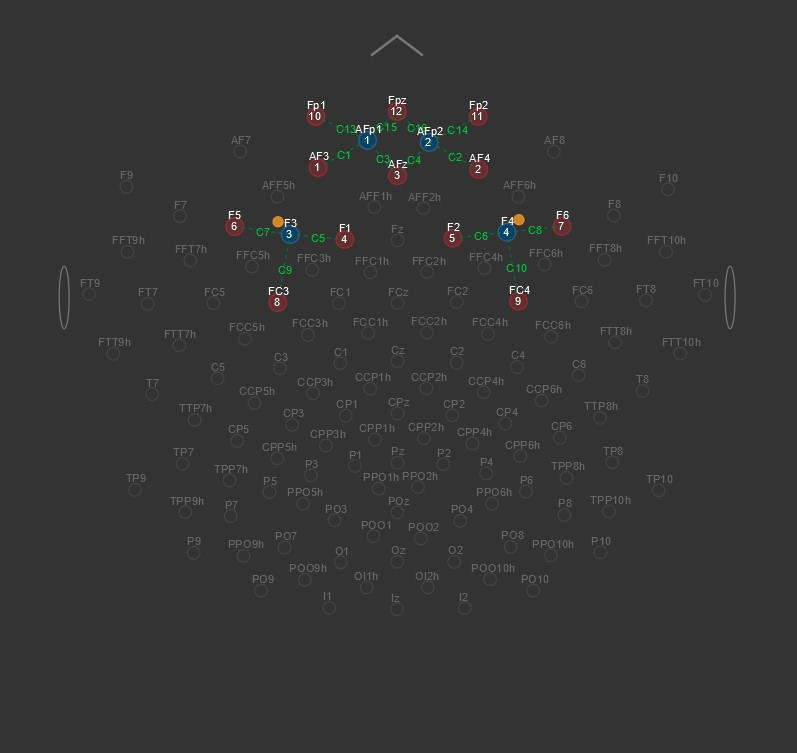
This montage covers prefrontal cortex regions, including the left and right dorsolateral prefrontal cortex (DLPC), of which activity is linked to increased attentional involvement in the performed task, and the middle frontal gyrus (MFG), associated with daydreaming or minds drifting off . Both structures’ signals are sometimes coupled with correct or incorrect task performance.
Visual stimulation
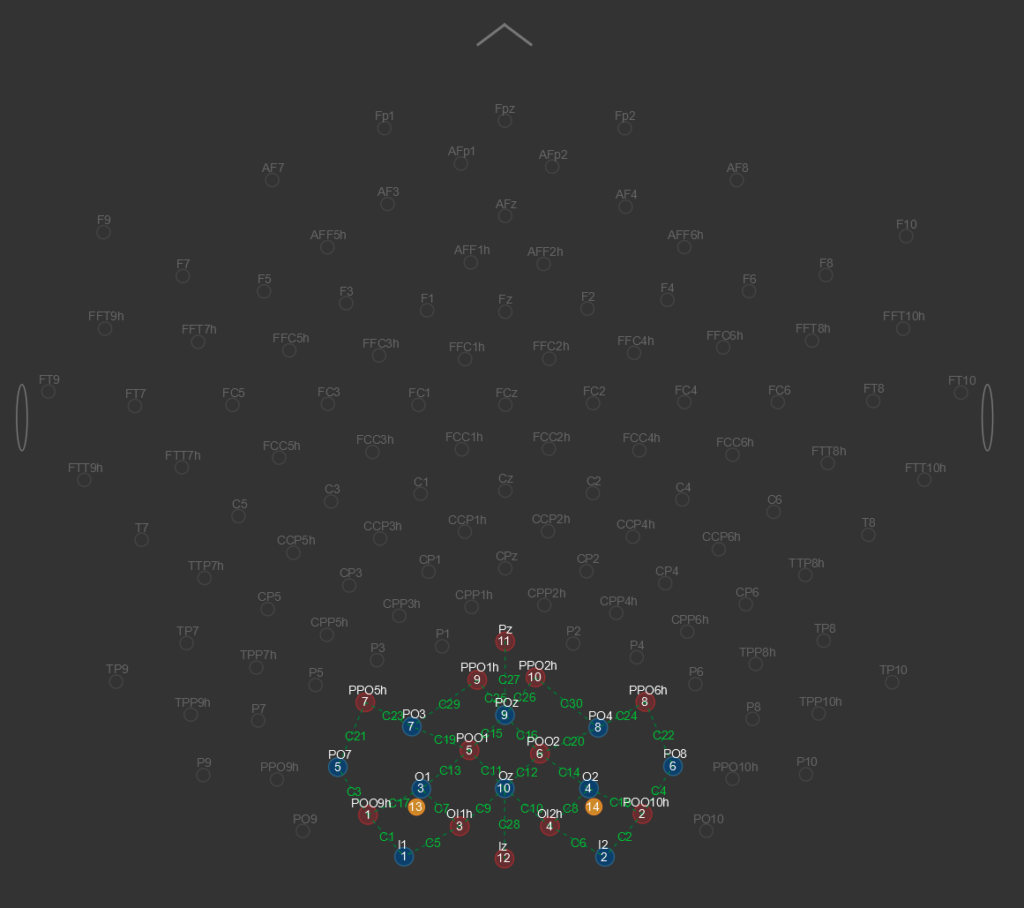
Here, optodes have been placed over the visual cortex to read its activity during stimulation with different frequencies or intensities of visual stimuli .
Multimodal processing
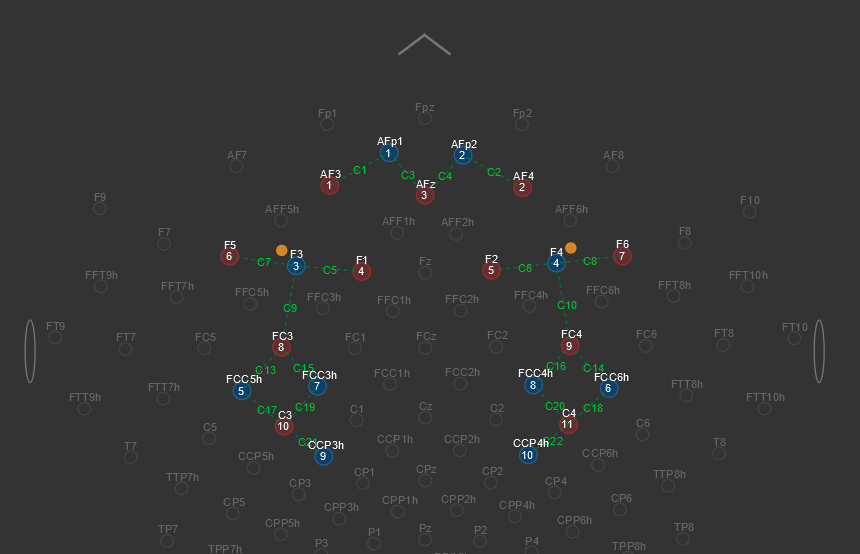
Optodes can also be located in ROIs away from each other, e.g. for studies focused on the relationship between different mental processes. In this case, optodes were placed over structures involved in motor, and cognitive activity.
Find some more information on how to create montages in CortiView here.
Yücel, M. A., Lühmann, A. V., Scholkmann, F., Gervain, J., Dan, I., Ayaz, H., … & Wolf, M. (2021). Best practices for fNIRS publications. Neurophotonics, 8(1), 012101.
Aasted, C. M., Yücel, M. A., Cooper, R. J., Dubb, J., Tsuzuki, D., Becerra, L., … & Boas, D. A. (2015). Anatomical guidance for functional near-infrared spectroscopy: AtlasViewer tutorial. Neurophotonics, 2(2), 020801.
Zimeo Morais, G. A., Balardin, J. B., & Sato, J. R. (2018). fNIRS Optodes’ Location Decider (fOLD): a toolbox for probe arrangement guided by brain regions-of-interest. Scientific reports, 8(1), 1-11.
Fu, X., & Richards, J. E. (2021). devfOLD: a toolbox for designing age-specific fNIRS channel placement. Neurophotonics, 8(4), 045003.
Batula, A. M., Mark, J. A., Kim, Y. E., & Ayaz, H. (2017). Comparison of brain activation during motor imagery and motor movement using fNIRS. Computational intelligence and neuroscience, 2017.
