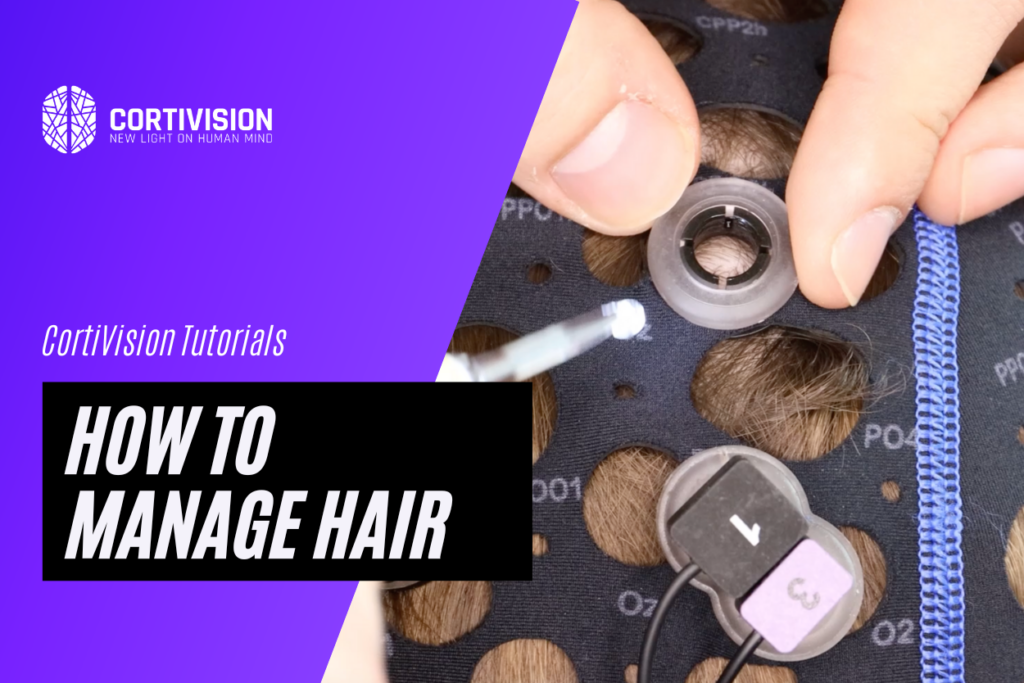
We have prepared a video for you, which presents a number of hair management tips for fNIRS. Video shows how to easily prepare a participant for fNIRS registration.
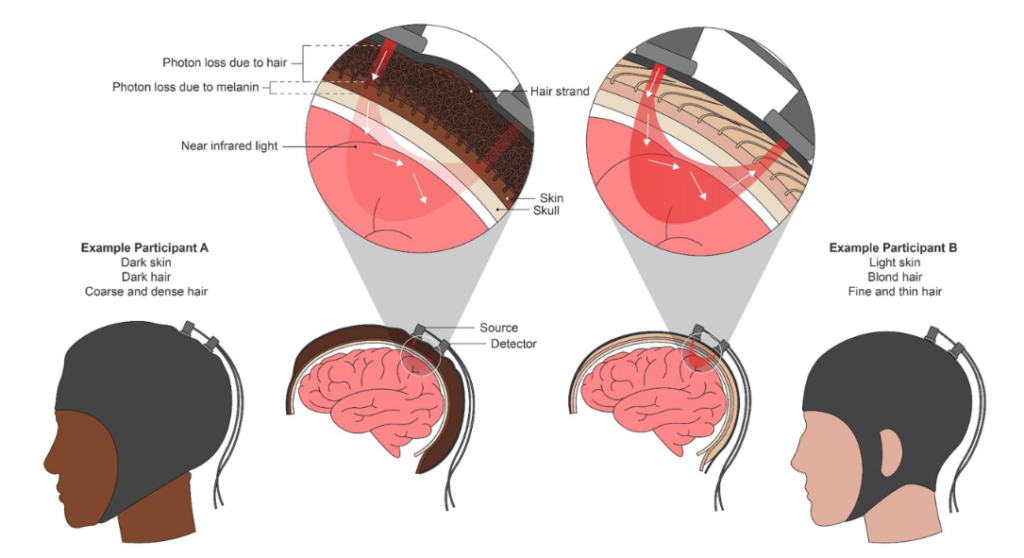
The fNIRS is susceptible to differences in the concentration of melanin in hair and skin, which affects the transmission of infrared light. The light emitted by the sources undergoes both absorption and scattering in the brain tissue until it is detected by the receiver. Two ‘challenges’ arise from this. The first is access to the scalp in people with thick and curly hair, where the optode has no physical contact with the scalp. The second is obtaining a high-quality NIRS signal once it reaches the brain tissue.
The optode must be as close as possible to the surface of the scalp to obtain an optimal signal. Any kind of obstruction between the optode and the scalp, especially hair, can significantly reduce the number of photons penetrating through the scalp and eventually to the brain surface . Dark hair causes a misestimation of the absorption properties, which reduces the intensity of the reemitted light when light attenuation improves with lighter hair .
Skin pigmentation and melanin concentration in hair
In the case of skin pigmentation, problems arise from the application modified Beer Lambert’s law. Its basic assumptions are that hemoglobin is the predominant absorber in the intrinsic skin, the tissue is optically homogeneous and the path length difference is invariant across skin tones.
Only a few layers of skin are optically heterogeneous, with melanin being the dominant absorber of NIR light in the epidermis and Hemoglobin in the dermis. However, as melanin is a strongly absorbing chromophore, higher concentrations result in greater absorption, thus reducing the difference in light path length, which is not accounted for in absolute hemoglobin estimates in current instruments.
Even if the fNIRS measures relative hemoglobin changes, systematic non-linear signal attenuation due to higher melanin concentrations can lead to inaccurate estimates (possibly underestimating) of relative oxygenation changes. These oversimplifying assumptions are particularly detrimental to data from individuals with skin pigmentation darker than two on the Fitzpatrick scale, a spectrum of skin tones ranging from 1 (lightest) to 6 (darkest) .

Fig. 1 The image shows two people with different phenotypes. A person with dark skin and curly hair (on the left) and one with light skin and straight blond hair. In the left person, both mechanical blocking due to hair texture and increased light absorption due to melanin weaken the NIR signal, potentially leading to an error in oxygenation estimation.
Given the difficulties presented, we propose a series of steps and actions to solve signal registration problems. With the help of these hair management tips, signal registration from Photon Cap will become more effective and efficient, enabling good signal quality.
Scalp Coupling Index is one method that calculates an objective measure of the signal-to-noise ratio (SNR) of a given fNIRS channel. It is defined as a scalp coupling index that quantifies the significance of the photoplethysmographic heart waveform, and which is mainly related to the pulsatile volume of blood circulating in the scalp . It is used to identify optical channels with poor coupling to the scalp, to exclude them from subsequent analyses. In simple terms, it is calculated as the correlation of the two wavelengths 760 and 850 nm. The threshold for an acceptable scalp coupling value is 0.8:
- Channels with values above 0.9 respectively are marked in green and are signed as good.
- Channels between values of 0.8 and 0.9 are marked in orange and signed as medium
- Channels below 0.8 are marked red and signed as bad. This means that they are rejected in subsequent analysis steps.
Pulsation and Mayer waves
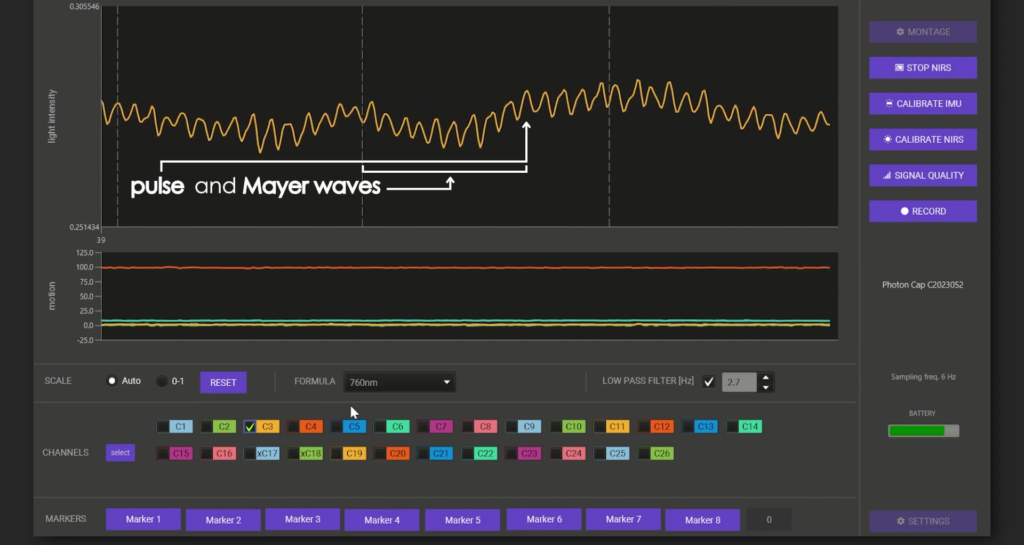
Recognizing a good signal from a raw signal involves identifying a pulse or Mayer wave in it. Pulse is one of the physiological processes that appear in the fNIRS signal as a component with a frequency near 1 hz. The heart rate curve has a clear rise and then a fall, forming a visible peak in heart rate. The height of this peak reflects the force of cardiac output and the volume of blood ejected with each contraction.
Mayer waves are systemic changes in arterial pressure with a frequency of 0.1 Hz . A Mayer wave is a regular, slow oscillation occurring in the intervals between heart contractions on an electrocardiogram (ECG). It’s characteristic pattern is a sinusoidal fluctuation that manifests as gentle peaks and valleys on the ECG time chart.

Fig 2. The graph shows the pulse and Mayer waves.

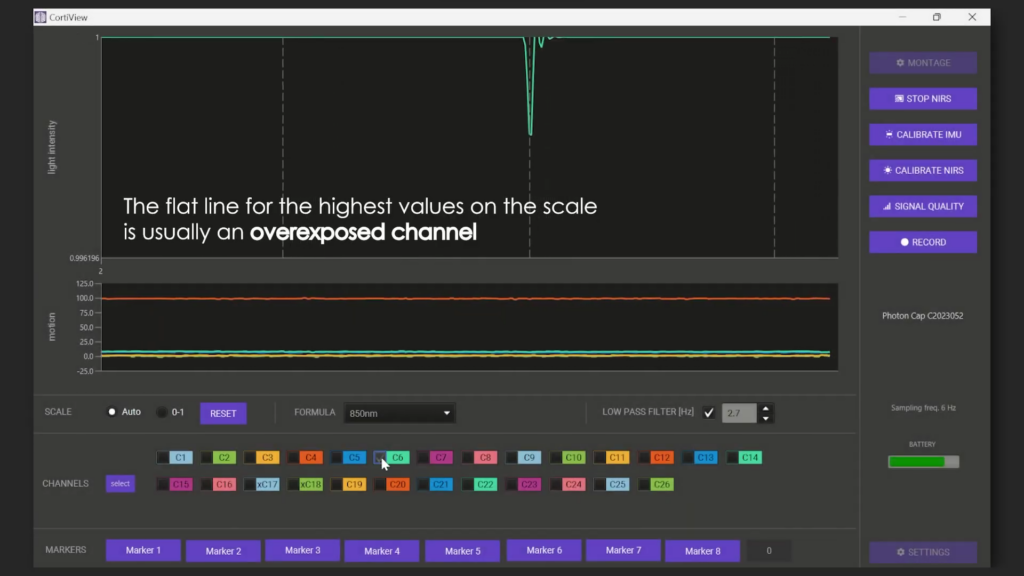
Fig 3. The graph shows the overexposed channel
Overexposure
In some cases, there is a chance of channel overexposure. This means that the intensity of the light emission exceeds the permissible scale. There are many reasons for this phenomenon:
- Poor contact between the optode and the skin
- Light complexion
- Too short a distance between the emitter and the detector
- Children (head size is smaller and tissues are thinner)
We can observe this on the graph in the form of a straight wave and occasional spikes appearing with unphysiological amplitudes. To prevent this we suggest:
- Check that the optode we are checking lies properly on the head, if necessary use distance guards
- Readjust the calibration until the gain values for both wavelengths are below the maximum value on the axis.
Kwasa, J., Peterson, H. M., Karrobi, K., Jones, L., Parker, T., Nickerson, N., & Wood, S. (2023). Demographic reporting and phenotypic exclusion in fNIRS. Frontiers in Neuroscience, 17. https://www.frontiersin.org/articles/10.3389/fnins.2023.1086208
Koizumi, H., Yamashita, Y., Maki, A., Yamamoto, T., Ito, Y., Itagaki, H., & Kennan, R. P. (1999). Higher-order brain function analysis by trans-cranial dynamic near-infrared spectroscopy imaging. Journal of Biomedical Optics, 4(4), 403–413. https://doi.org/10.1117/1.429959
Fang, X., Pan, B., Liu, W., Wang, Z., & Li, T. (2018). Effect of Scalp Hair Follicles on NIRS Quantification by Monte Carlo Simulation and Visible Chinese Human Dataset. IEEE Photonics Journal, 10(5), 1–10. https://doi.org/10.1109/JPHOT.2018.2865427
Tong, Y., Hocke, L. M., Licata, S. C., & Frederick, B. deB. (2012). Low-frequency oscillations measured in the periphery with near-infrared spectroscopy are strongly correlated with blood oxygen level-dependent functional magnetic resonance imaging signals. Journal of Biomedical Optics, 17(10), 106004. https://doi.org/10.1117/1.JBO.17.10.106004
Chaddad, A. (2014). Brain Function Diagnosis Enhanced Using Denoised fNIRS Raw Signals. Journal of Biomedical Science and Engineering, 2014. https://doi.org/10.4236/jbise.2014.74025
Pollonini, L., Olds, C., Abaya, H., Bortfeld, H., Beauchamp, M. S., & Oghalai, J. S. (2014). Auditory cortex activation to natural speech and simulated cochlear implant speech measured with functional near-infrared spectroscopy. Hearing Research, 309, 84–93. https://doi.org/10.1016/j.heares.2013.11.007